Clean data, confident results
In clinical research, ensuring the highest standard of data quality is absolutely essential. But lurking beneath clean-looking outputs, there often exist elusive troublemakers: non-printable and special characters. These can include anything from invisible carriage returns and tabs to subtle accented letters and non-ASCII symbols introduced during various stages of data handling.
Invisible disruptors can cause a wide range of issues including incorrect counts, unreadable reports, and strange formatting in final deliverables. In a field where accuracy is paramount for both patient safety and regulatory compliance, overlooking these hidden characters could jeopardize the integrity of an entire study.
Identifying, addressing, and preventing such data anomalies is a fundamental step toward reliable results and robust scientific conclusions. At Catalyst Clinical Research, our biostatistics team has developed a dual-language solution in SAS and R programming languages to detect and clean these hidden characters efficiently across all datasets in a study.
Why worry about special characters?
These characters, like carriage returns, tabs, or accented letters can sneak in during manual data entry, transfers between systems, file conversions, and automated data processing scripts. The consequences extend far beyond being inconvenient. If undetected, special characters can compromise the validity of statistical analyses, mislead clinical study teams, and delay the submission of crucial deliverables to regulatory bodies.
In-house tools and solutions
We built custom tools to address these special characters:
SAS macro: %scnprpt
This macro:
- Scans all datasets in a SAS library
- Replaces or removes non-printable/special characters
- Logs all modifications (dataset, variable, character type, replacement)
- Outputs a PDF report and optionally a clean Excel reference sheet for adjustments
The macro reads predefined rules from Excel or creates its own default list of characters. It even allows options like “nospace” when replacements shouldn’t add whitespace.
R functions: replace_special_characters() and convert_sas_datasets()
In R, we created two user-defined functions:
- replace_special_characters() – Iterates through character columns and replaces values using a metadata sheet
- convert_sas_datasets() – Reads .sas7bdat files, applies replacements, and writes clean Excel/XPT files with updated column names
Real-world impact
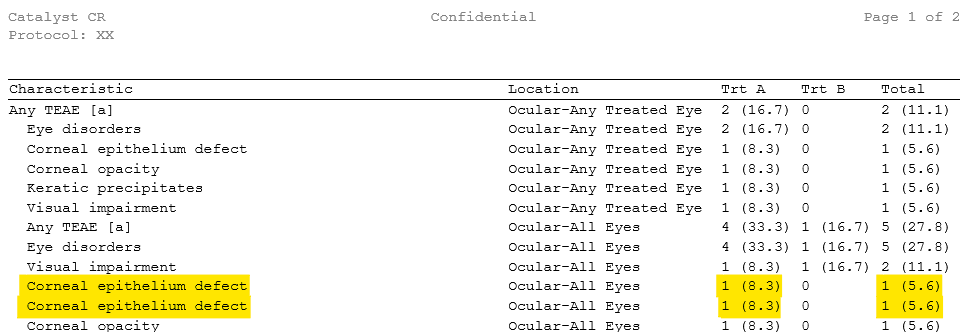
In a simple example, a line-feed character hidden in the value “Corneal epithelium defect” could split it into two entries, causing incorrect counts in safety summaries. Our tools ensure such discrepancies are caught and corrected before the data goes into reporting or submission packages.
Final output
Our tools generate easy-to-review reports showing which datasets/variables were affected, what characters were found, and how they were handled. This enables traceability and smooth communication between statistical programmers and data management:
Why these actions matter
With increasing regulatory scrutiny and data volumes, automation in data cleaning is no longer optional. Our SAS and R tools help ensure that study data is clean and regulatory compliant and statistical reports are accurate and reproducible.
These tools enable our biometrics teams to save time and reduce the manual effort required when these characters do slip into statistical reports, ultimately saving you crucial time.
Contributed by Eldho Alias, Principal Statistical Programmer; Vishal V Nair, Statistical Programmer III; Pooja Pradeep Pillai, Statistical Programmer II; and Hardik Sheth, Statistical Programming Technical Manager.
Reach out to Catalyst Flex to meet with our biometrics team and learn more.